
Trump Touts Chart Showing Lowest Cumulative Inflation of Last 10 Terms
Trump shares a chart placing his second term's cumulative CPI-U inflation at 4.71%, the lowest of the past 10 presidential terms, citing federal price data through month 18.

WASHINGTON D.C. — Donald Trump amplified a chart claiming his second term carries the lowest cumulative inflation of the past 10 presidential terms, drawing on federal price data.
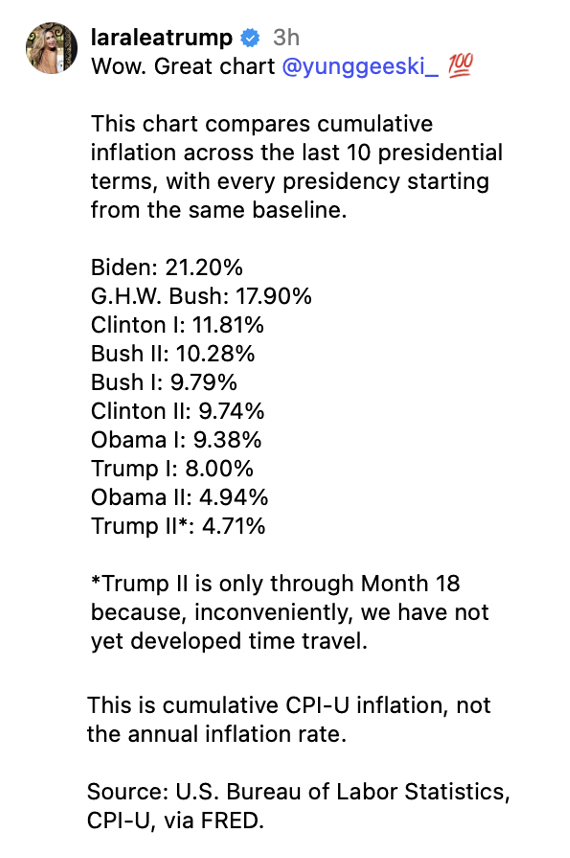
The chart, reposted from Trump’s daughter-in-law Lara Trump, ranks cumulative CPI-U inflation from each term’s start. It places Trump’s second term at 4.71% through month 18 and President Biden’s single term at 21.20%, the highest on the list. The figures cite the U.S. Bureau of Labor Statistics via the Federal Reserve Economic Data service.
Here is the full post on truthsocial: “laraleatrump 3h Wow. Great chart @yunggeeski_100 This chart compares cumulative inflation across the last 10 presidential terms, with every presidency starting from the same baseline. Biden: 21.20% G.H.W. Bush: 17.90% Clinton I: 11.81% Bush II: 10.28% Bush I: 9.79% Clinton II: 9.74% Obama I: 9.38% Trump I: 8.00% Obama II: 4.94% Trump II*: 4.71% *Trump II is only through Month 18 because, inconveniently, we have not yet developed time travel. This is cumulative CPI-U inflation, not the annual inflation rate. Source: U.S. Bureau of Labor Statistics, CPI-U, via FRED.” on August 9, 2026 at 4:19 PM ET.
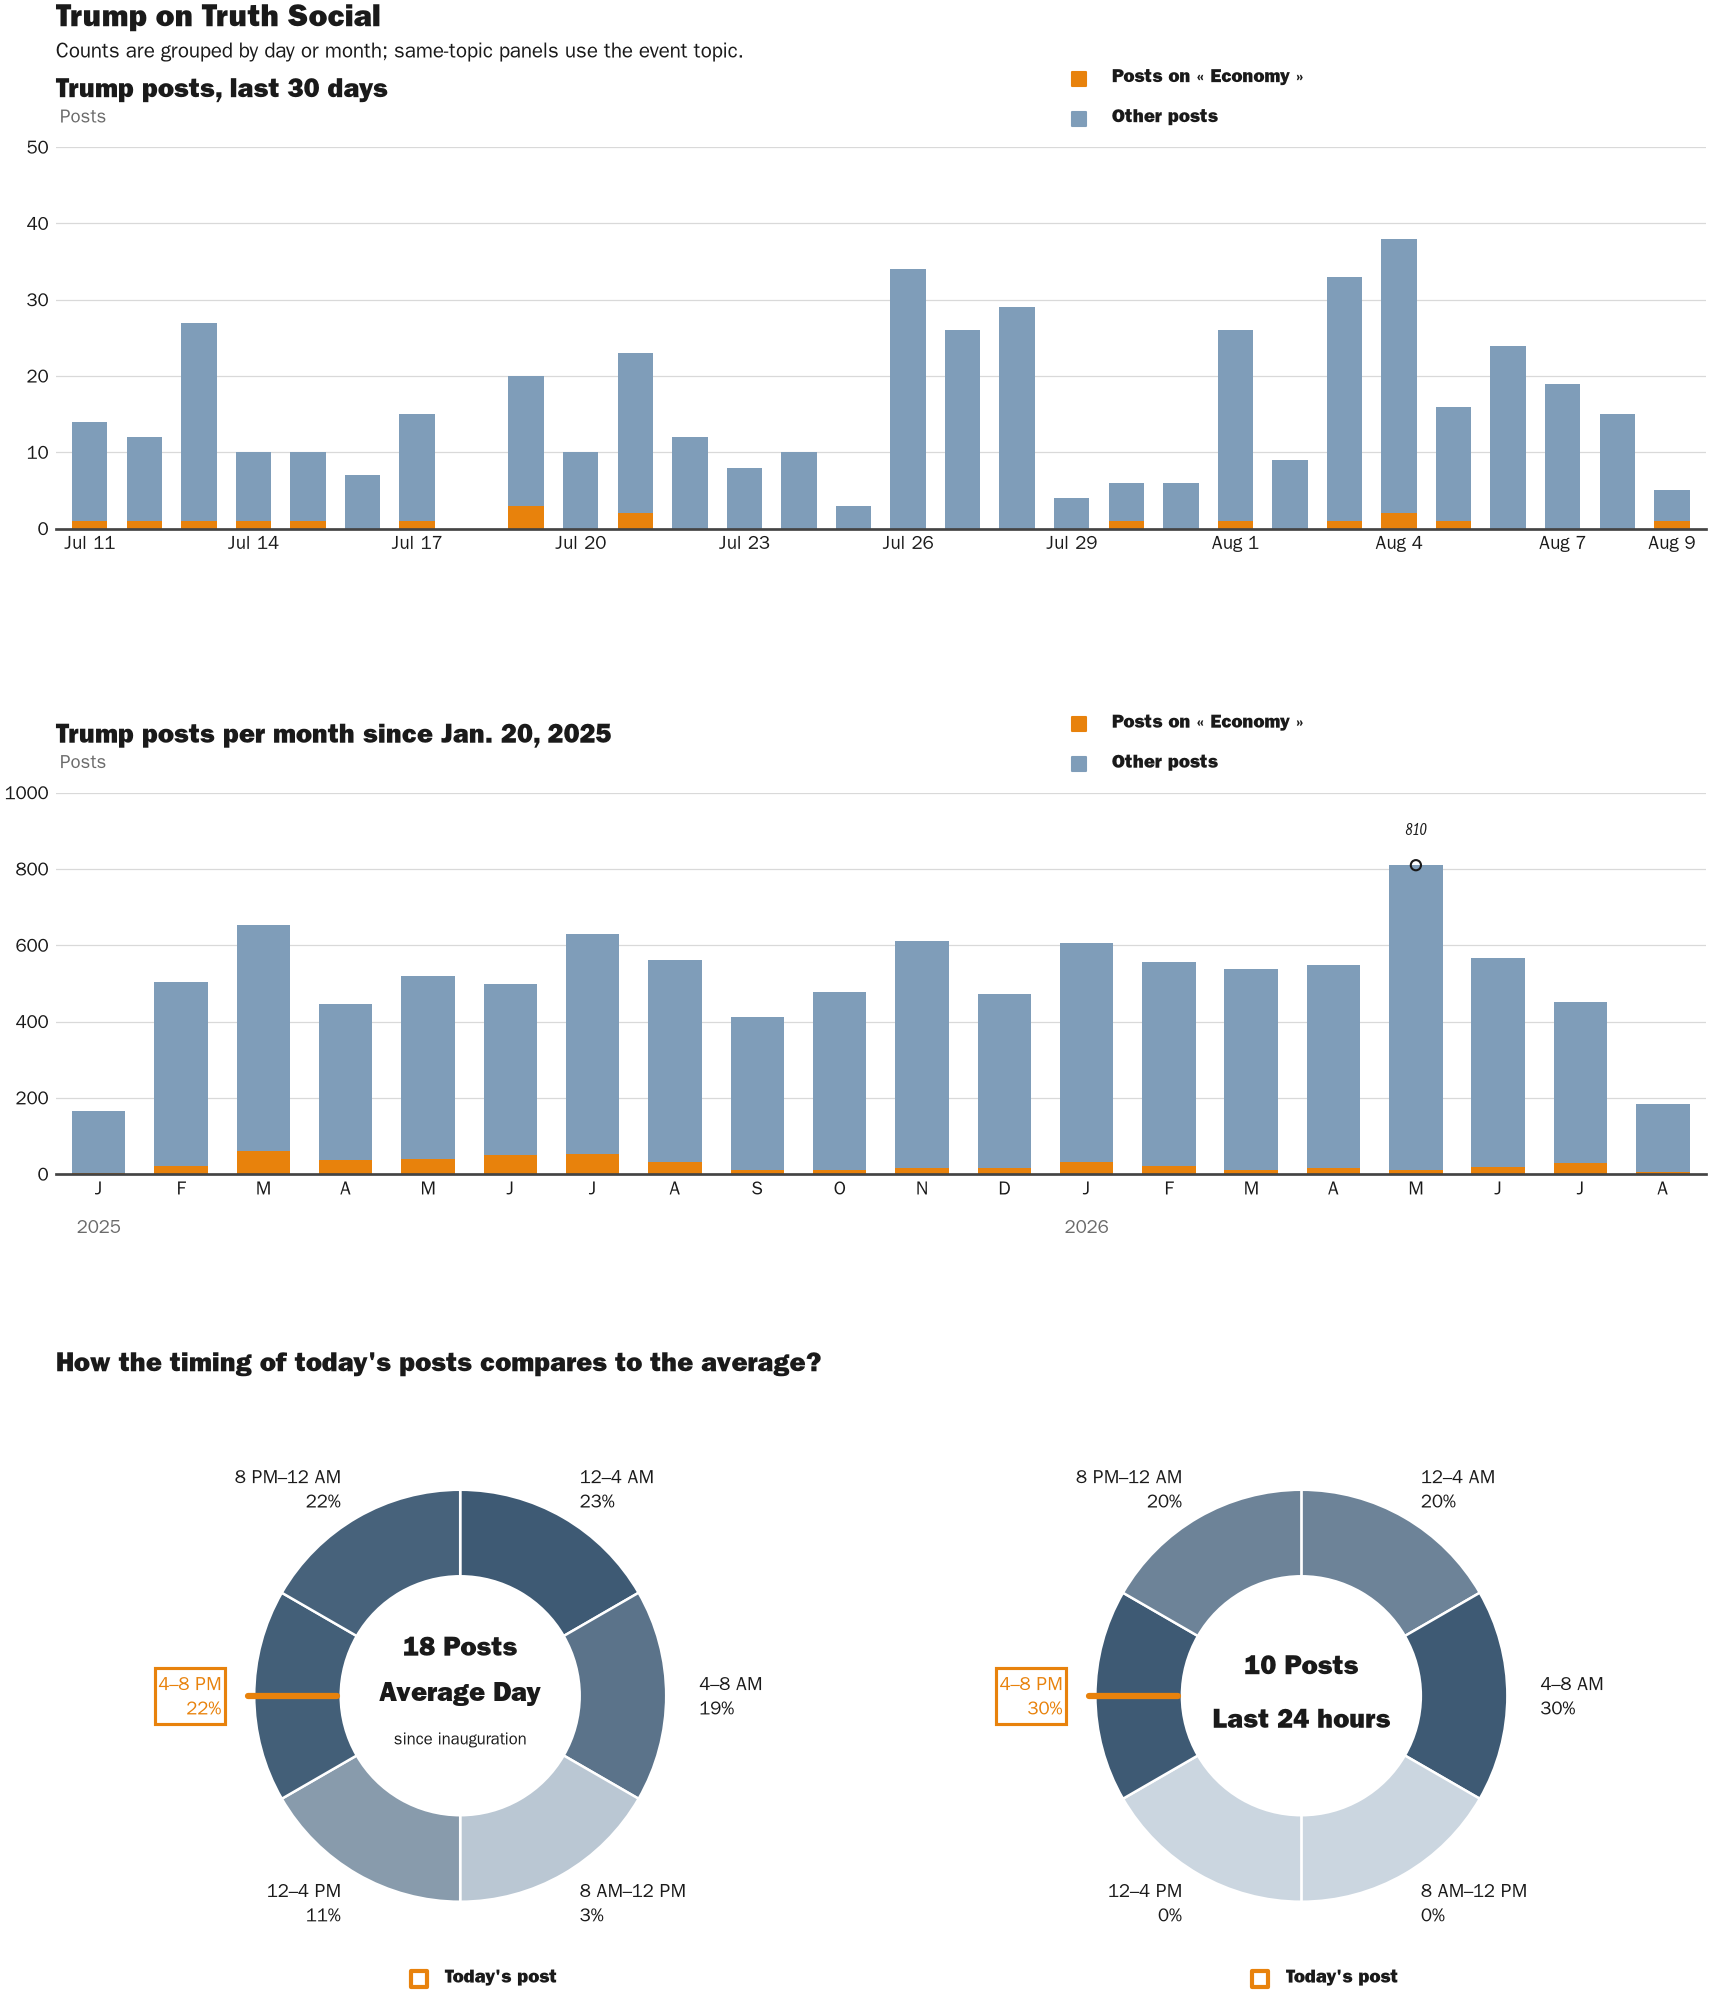
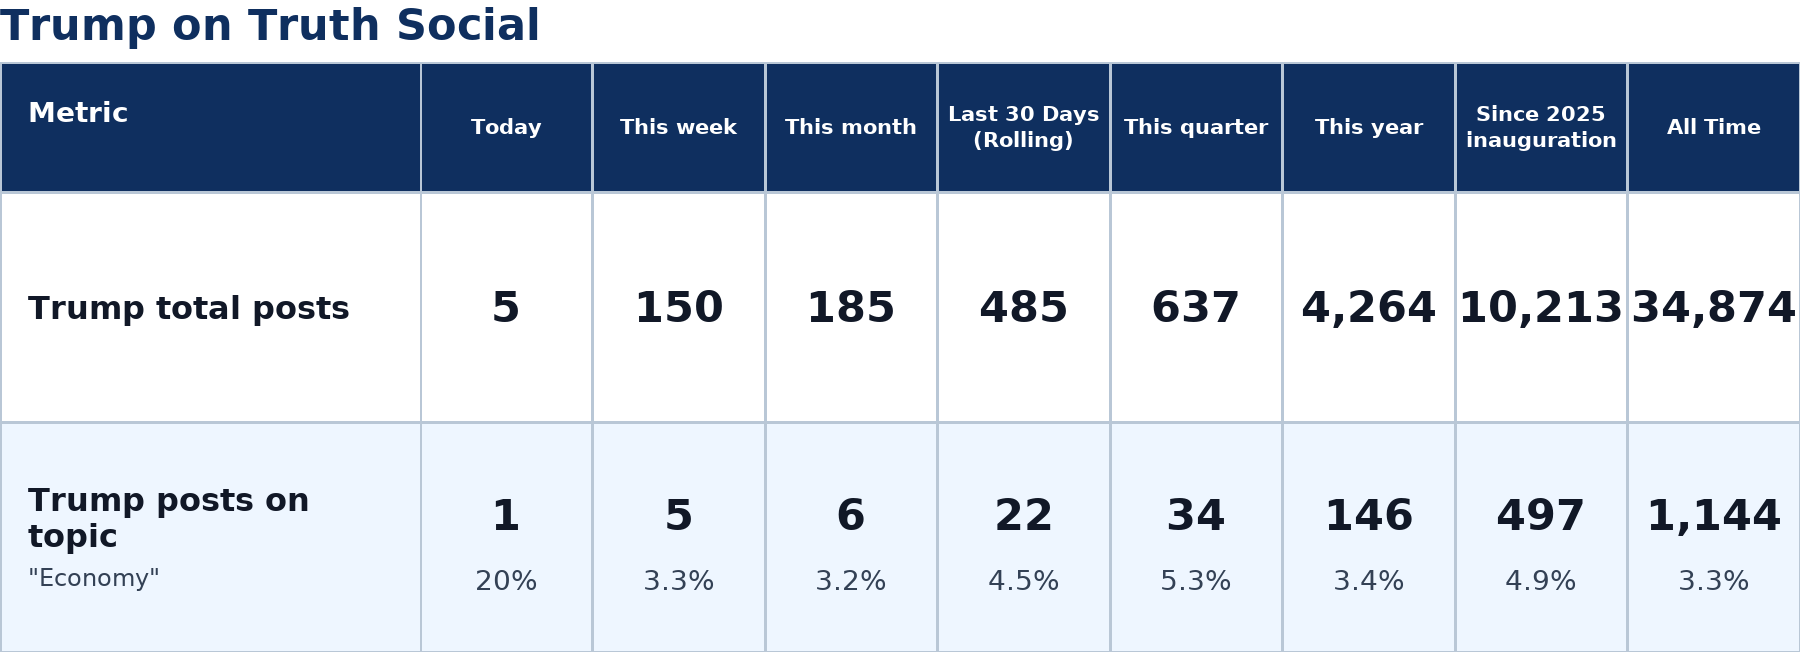
This is Trump’s fifth message released today, and the last post was 0 minutes ago, and it is not part of a thread. On average, Trump produces 18 posts per day since his inauguration on January 20, 2025. The move fits a broader pattern in Trump’s recent messaging, with 22 of his 485 posts over the last 30 days classified as Economy posts.
The chart draws a sharp contrast between the two most recent administrations. Trump’s second term registers 4.71% cumulative inflation, while Biden’s four years register 21.20%, according to the figures attributed to the U.S. Bureau of Labor Statistics. The post notes a key caveat directly: the Trump second-term figure covers only 18 months, not a full four-year term, and the other terms span longer windows.
Cumulative inflation and the annual inflation rate measure different things. Cumulative CPI-U inflation adds up price increases over an entire period, while the annual rate captures the pace of price growth over a single 12-month stretch. A shorter measurement window produces a smaller cumulative total, which the post’s month-18 footnote acknowledges. The comparison therefore favors any term measured over less time.

President Donald J. Trump shares a chart on Truth Social in Washington D.C.
© copyright Zenger.News
Inflation touches nearly every household budget, shaping the cost of groceries, rent, fuel and borrowing. For the average reader, cumulative inflation figures explain why prices sit higher today than at the start of a given presidency. A lower cumulative figure signals prices climbed less over the measured stretch, though it does not indicate that prices fell.
The posting of inflation charts by figures close to the president has happened before. Trump and his allies have repeatedly cited Bureau of Labor Statistics price data to frame economic performance. Lara Trump, a Republican National Committee co-chair through 2024, has regularly promoted such comparisons on social platforms and in broadcast segments.
The next official update to the underlying data will come from the U.S. Bureau of Labor Statistics, which publishes the Consumer Price Index on a monthly schedule. A specific date tied to any response or revision of this particular chart has not been announced.
Presidential contests have long been fought over the price of everyday goods, as happened before. In 1980, cumulative inflation across President Carter’s single term ran into the double digits, and Ronald Reagan hammered the point with his debate question asking voters whether they were better off than four years earlier. Reagan won 44 states that November, and the episode fixed inflation as a durable weapon in American campaign politics for the decades that followed.
NewsFindr Chart Maker
Photo by Zenger real-time database of all Truth Social posts.
Zenger analysis
Photo by Zenger analysis