Trump posts pre-conflict market snapshot to frame Iran military action
Trump a Truth Social graphic lists oil prices and stock indices from February 27, 2026, labeled “the day before the Iran conflict,” as a baseline for economic comparison.

WHITE HOUSE — Donald Trump posted a graphic cataloging oil prices and major stock market indices from what he labeled “the day before the Iran conflict” on a Truth Social post on July 5, 2026 at 11:26 AM EST (see truthsocial).
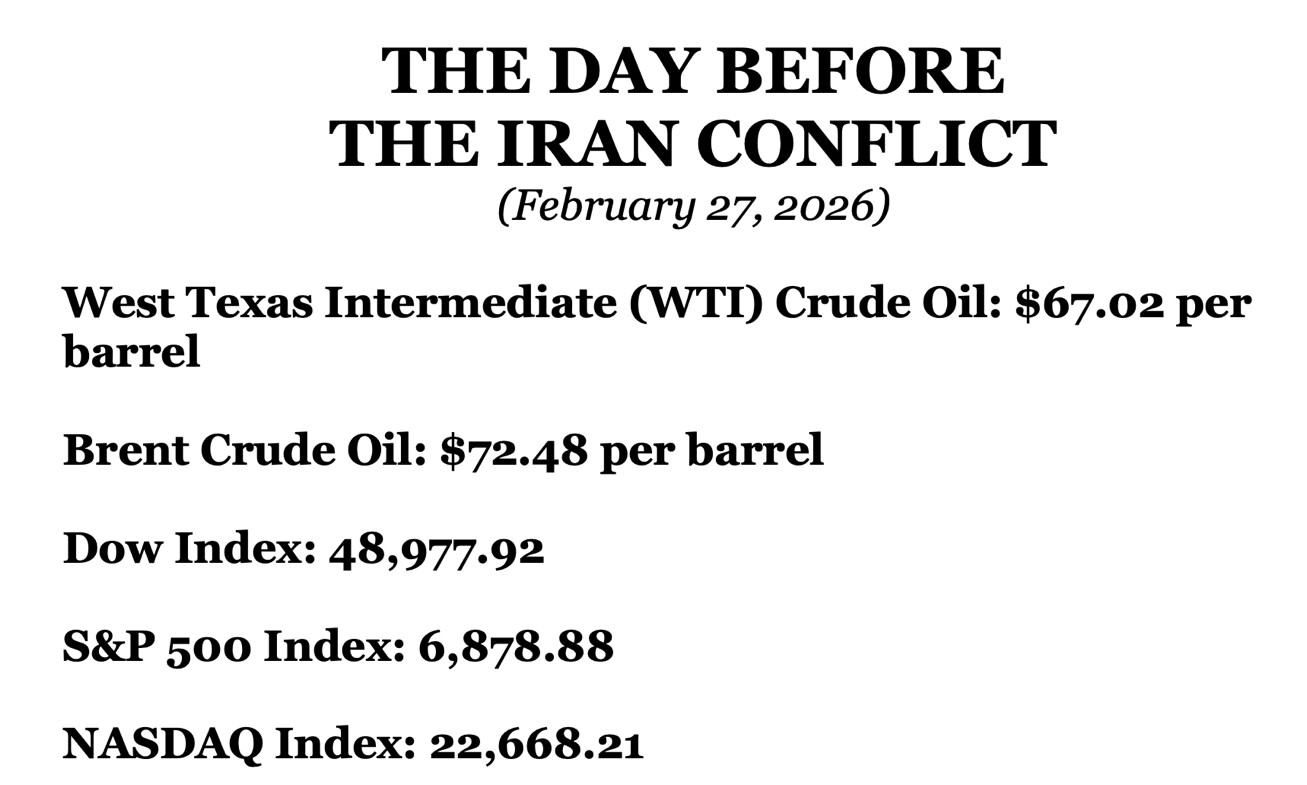
Here is the full post on [truthsocial]: “THE DAY BEFORE THE IRAN CONFLICT (February 27, 2026) West Texas Intermediate (WTI) Crude Oil: $67.02 per barrel Brent Crude Oil: $72.48 per barrel Dow Index: 48,977.92 S&P 500 Index: 6,878.88 NASDAQ Index: 22,668.21”
The post consists of a white text-based infographic listing five financial benchmarks attributed to February 27, 2026. West Texas Intermediate crude oil stood at $67.02 per barrel and Brent crude at $72.48 per barrel on that date. The Dow Jones Industrial Average was listed at 48,977.92, the S&P 500 at 6,878.88 and the NASDAQ Composite at 22,668.21.
The framing of the graphic as a snapshot from “the day before the Iran conflict” suggests an effort to establish a baseline for comparing economic conditions before and after military action involving Iran. The approach mirrors a tactic used in political messaging to argue that markets or energy prices were stable before a major policy or military event, implying the action did not cause lasting economic damage or was managed responsibly.

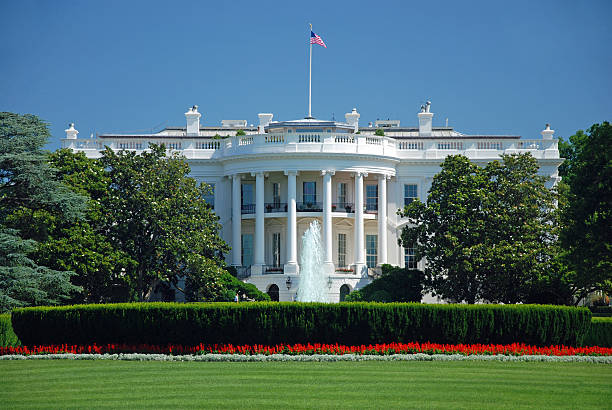
President Donald J. Trump posted an infographic at the White House on 07/05/2026.
© copyright Zenger.News
The post does not specify what “the Iran conflict” entailed, when it concluded or what market levels looked like afterward. No further context, sourcing or comparison data accompanied the graphic. The absence of post-conflict figures leaves the implicit argument incomplete, requiring readers to supply their own conclusions about the economic impact.
Oil prices at the levels cited in the graphic — WTI at $67.02 and Brent at $72.48 — would represent relatively moderate levels by recent historical standards. Major U.S. equity indices at those levels would reflect continued growth from late-2025 trading ranges, though the post does not address whether those figures were verified against official closing data from that date.
In the last 30 days, 25 of 521 Trump posts on Truth Social addressed the topic of “Economy,” making economic messaging a recurring but not dominant theme in his social media output during this period.
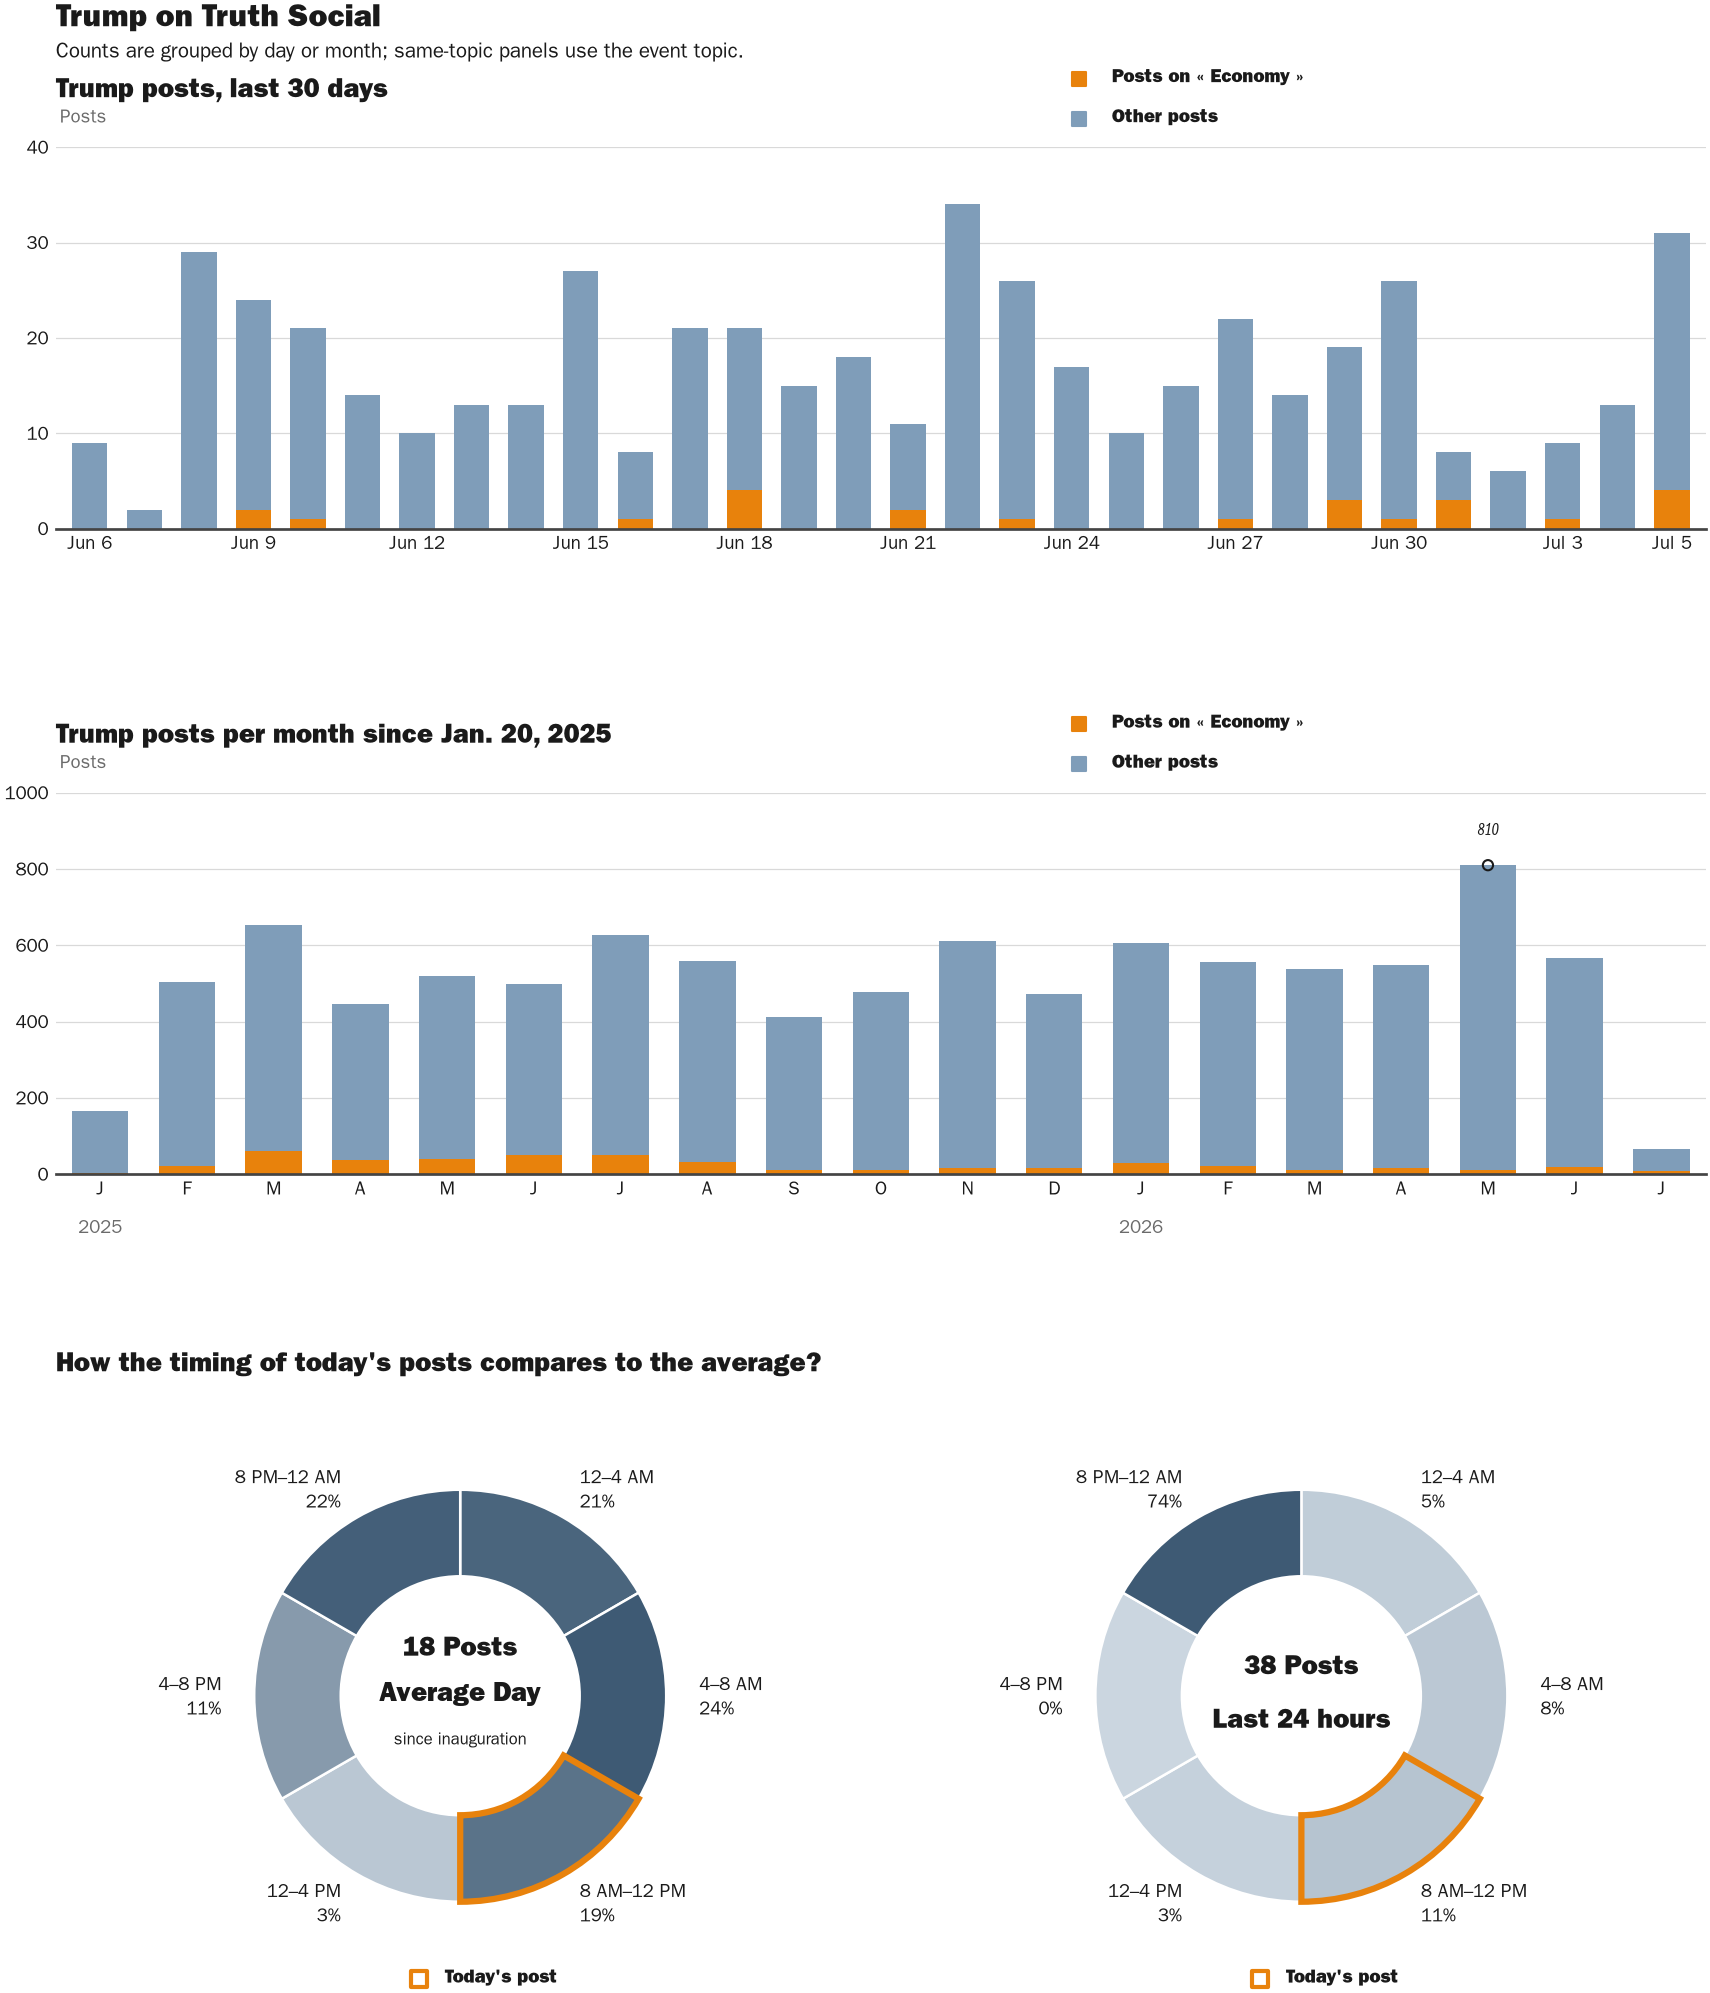
Source: Zenger real-time database of all Truth Social posts.
Note: Chart generated on July 5, 2026 at 11:42 AM EST
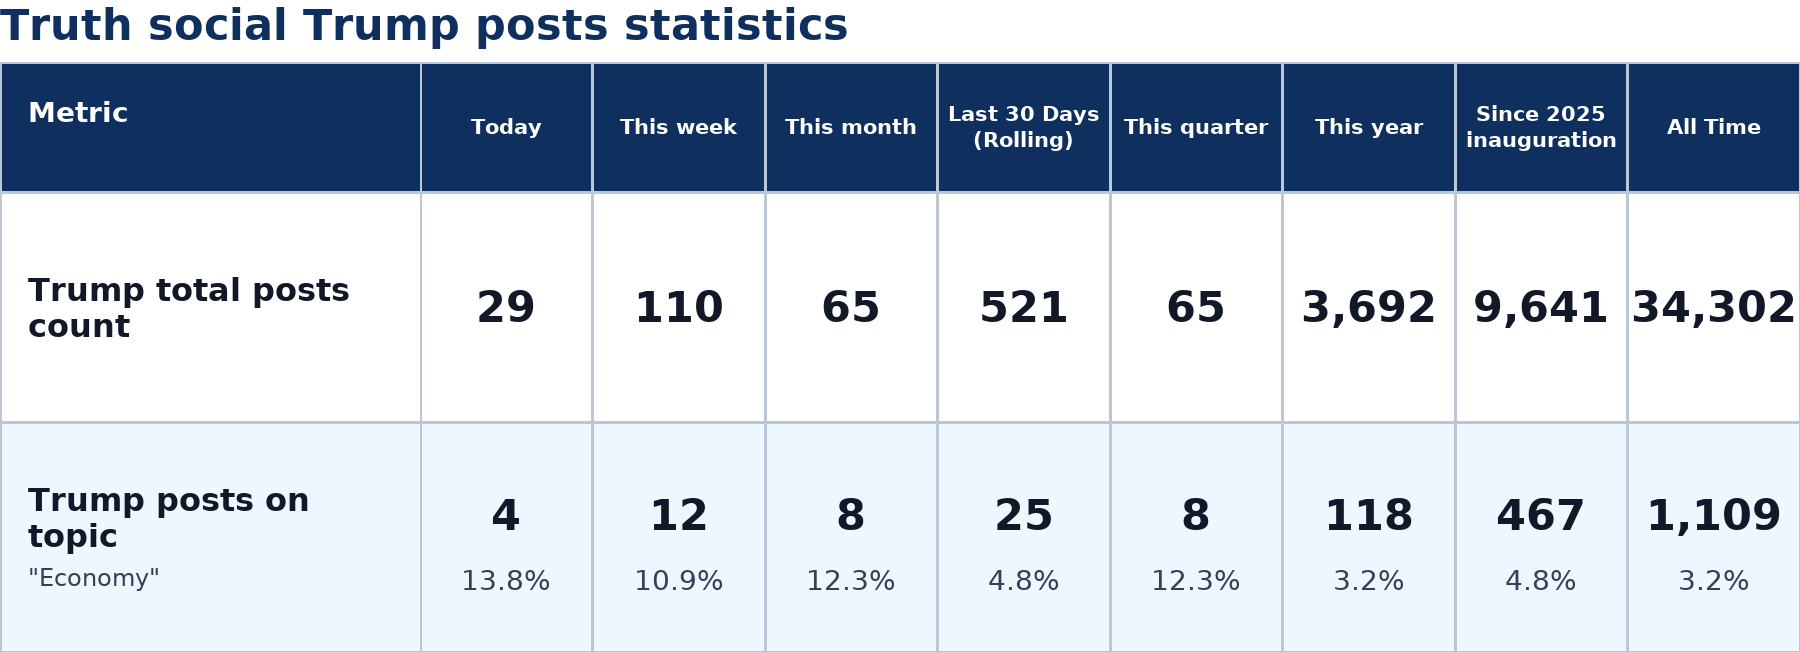
Source: Zenger analysis
Note: Table generated by https://zenger.news on July 5, 2026 at 11:42 AM EST